
West Hub Wind Generation
An ERCOT West Hub comparison illustrates how wind penetration and energy-price volatility evolved.
Historical Patterns Observed
Why the Data Matters for DER Economics
Markets
Outcomes
DECH reviewed ERCOT West Hub interval prices in 2011, 2016, and 2022 while comparing wind generation’s expanding share of the resource mix.
The objective was to examine price volatility, including negative-price intervals and periods above $100/MWh.
Historical Patterns Observed
The analysis found more intervals below zero during lower-demand periods and greater price dispersion in 2022 than in 2016.
Average electricity prices did not decline simply because the share of wind generation had increased.
Why the Data Matters for DER Economics
Volatile hourly prices can create optionality for flexible resources, but profitability depends on the specific ability of equipment to respond during high-value intervals.
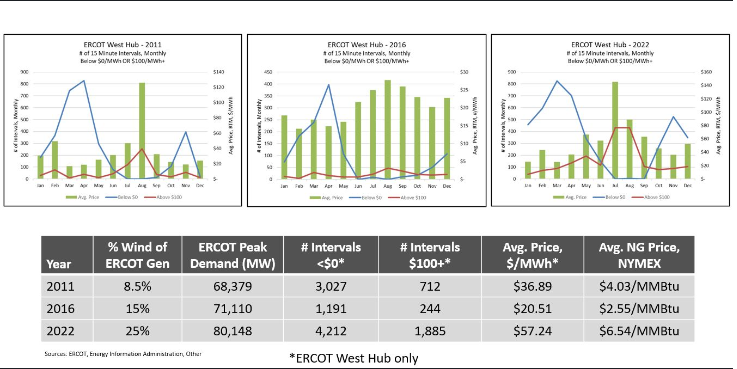
Historical ERCOT West Hub analysis; not representative of current market prices.
Explore Distributed Energy Opportunities With DECH
Understand local market conditions, investment economics, and the practical requirements for distributed energy projects.